Forage Testing for Alpacas: How to Read and Use Your Hay Analysis Reports
By Dr. Robert Van Saun
Professor and Extension Veterinarian, Penn State University
Key Points
- Forage quality is the foundation of alpaca nutrition, and testing provides the most accurate assessment of the nutrients your herd receives.
- Proper sampling—using a hay probe, collecting cores from multiple bales, and sending a well-mixed subsample—is essential for reliable forage test results.
- Key values to review include moisture, crude protein, soluble protein, NDF, ADF, nonstructural carbohydrates (NSC), and mineral content.
- Understanding forage test reports helps you evaluate hay maturity, identify nutritional gaps, and build balanced diets that support microbial health and overall alpaca productivity.
- Interpreting protein, fiber, carbohydrate, and mineral fractions allows owners to prevent deficiency or excess, both of which contribute to poor performance and disease risk.
Forage is the foundation of the camelid diet and the primary source of essential nutrients to support body metabolism and productivity. How well a forage meets the nutritional requirements of a given alpaca will depend on the nutrient content of the forage being consumed and the amount of forage consumed. The ability of a forage to provide nutrients within a reasonable intake is characterized as “forage quality.”
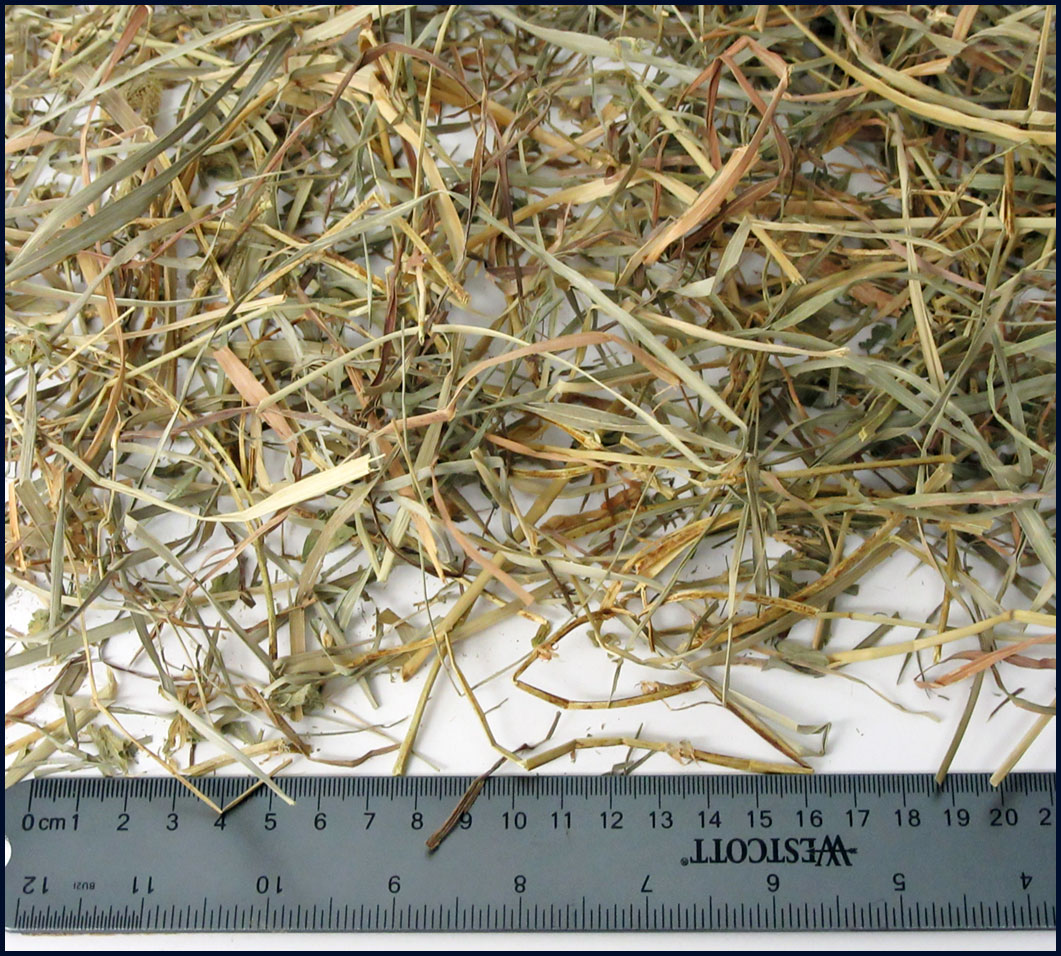
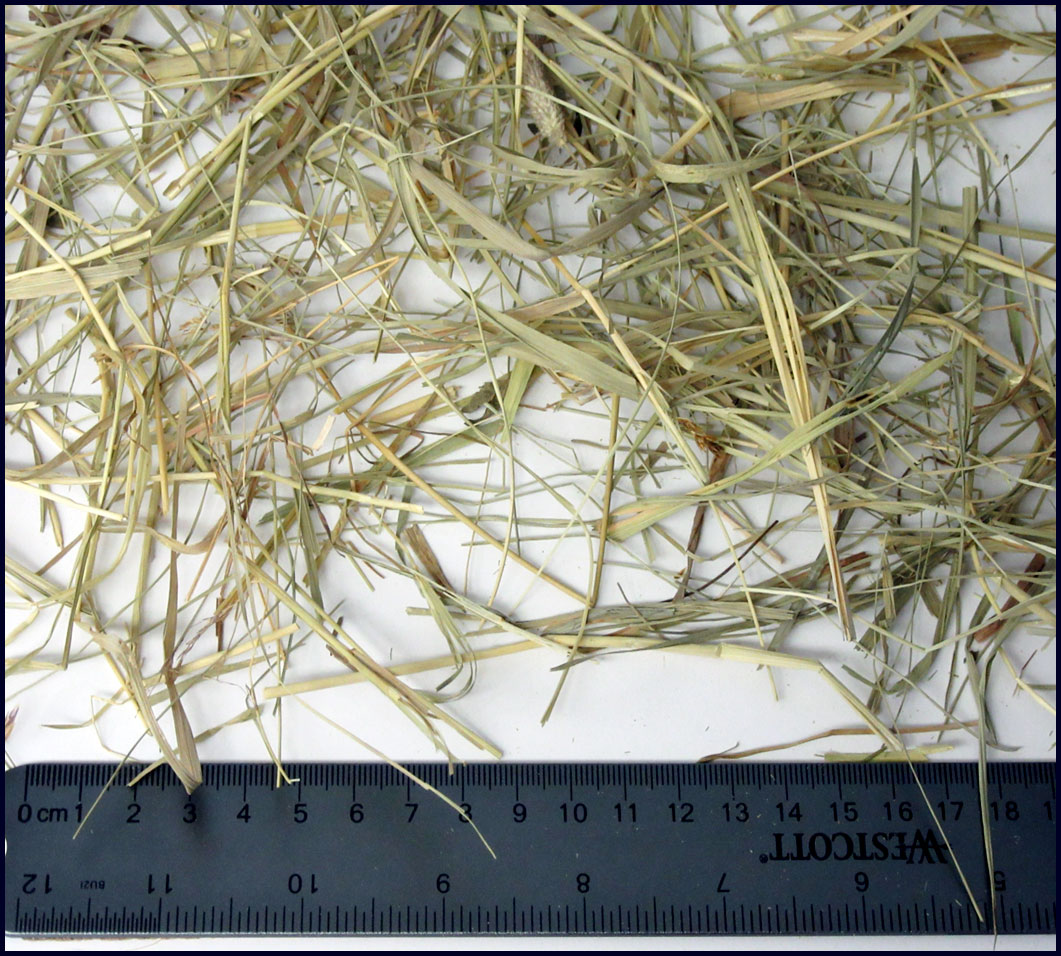
Most camelid producers assess forage quality qualitatively through organoleptic parameters of color, smell, visual assessment, and tactile estimation of maturity (leaf-to-stem ratio and rigidity of stems). An example of visual differentiation of forage quality is provided in Figure 1. Producers’ use of forage testing through time-tested chemical parameters is rarely used for a variety of reasons, including costs, frequent purchasing of hay, and a lack of interpretation abilities. However, more complex analytical procedures and biologic parameters are needed to truly differentiate between a higher and lesser quality forage and its role in meeting microbe and camelid needs.
A properly balanced diet that meets the needs of the compartment-1 microbial flora and the camelid is essential to maintaining good health and productivity. An investment in forage testing is the single best way to achieve this end.
Getting Started: Sampling and Laboratory Selection
Our ultimate goal in spending money to have forage testing completed is to obtain usable information on nutrient composition so we can provide a more complete and balanced diet for the animals. The adage “garbage in, garbage out” applies. If we do not obtain a representative sample and have appropriate testing performed, the numbers we receive will not be very useful in fine-tuning diets.
A good place to start is the National Forage Testing Association (NFTA) website. There you can find information on hay probes for collecting good samples and appropriate sampling methods to obtain accurate results. NFTA also maintains a searchable list of certified laboratories. Use of a certified laboratory provides more confidence in the results obtained, and these labs are often willing to retest unusual results to confirm the numbers.
Use of a hay probe is highly recommended over taking “grab” samples from various hay bales. You should collect two to three cored samples from at least 10 percent of the hay inventory. More is better in obtaining the most representative sample. Different harvests or lots of hay should be sampled and tested separately and not combined.
Once sampling is completed, the material should be mixed thoroughly in a clean, dry bucket, then subsampled to send to the laboratory. Subsampling is accomplished by placing your total sample on a clean, impermeable surface, mixing thoroughly, and then using a yardstick or similar implement to divide the mixed material into four quarters. Combine the material from two opposing quarters to make your submitted sample.
Communicate with the laboratory to determine the desired amount of sampled forage to send for all requested tests. If you send too much material, the laboratory will need to take a subsample, which may not be representative of your forage. A simple Google search for “forage sampling methods” will provide several good extension-based videos on forage sampling techniques.
Forage testing methods
Standardized chemical methods of feed analysis were developed more than 200 years ago. The proximate analysis system that includes crude protein (CP), crude fiber (CF), ether extract (EE), and ash has been in use for more than 100 years. This system is not adequate to fully characterize feed composition relative to microbial fermentation and animal needs.
Newer chemical and biological methods of feed analysis that better relate to nutritional function have been developed over the past 40 years and continue to evolve (see Box A). Newer biologic methods, such as determining rumen protein or neutral detergent fiber degradability, should be interpreted with caution for alpacas because these methods are largely validated in dairy cattle.
The gold standard for testing procedures is wet chemistry. More recently, near-infrared spectroscopy (NIR) methods have been improved and have become mainstream for routine analyses. One advantage of NIR is lower cost. One concern is that NIR cannot accurately assess mineral content. Quality laboratories will indicate which feeds are appropriate for NIR testing, based on robust calibration data. Most forage samples will have good calibration criteria for nutrient content other than minerals.
Understanding the "Forage Language"
In any discipline there are terms that may be unfamiliar, and forages and feed testing are no exception. This often becomes the first obstacle when owners consider paying for testing.
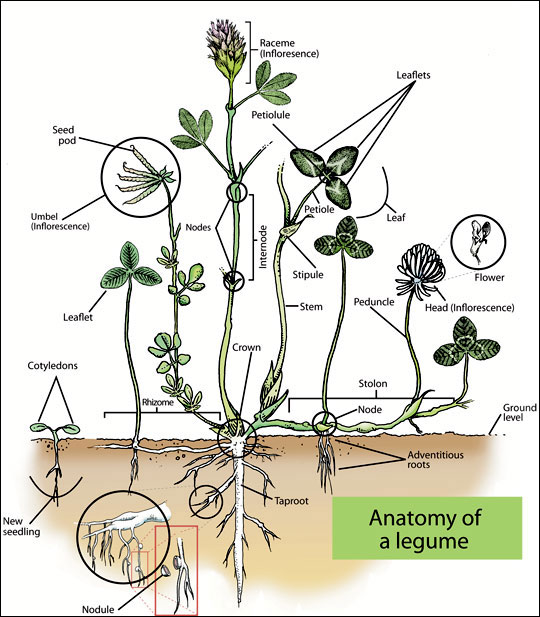
There are two groups of agronomically important plants used for feeding animals: grasses and legumes. These two groups have fundamental differences in plant structure (Figure 2) and nutrient composition (Table 1).
| Table 1. Typical test values of alfalfa (legume) and grass forages harvested at various stages of plant maturity (dry matter basis). | |||||
Hay Type and Maturity Stage |
CP
|
ADF
|
NDF
|
ME
|
TDN
|
Alfalfa | |||||
| Pre-bloom | > 19 | < 31 | < 40 | 1.03–1.13 | 63–66 |
| Early bloom | 17–19 | 30–35 | 40–46 | 0.98–1.02 | 60–62 |
| Mid bloom | 13–16 | 36–41 | 46–51 | 0.92–0.97 | 56–59 |
| Late bloom | < 13 | > 41 | > 51 | < 0.90 | < 55 |
Grass | |||||
| Prehead | > 18 | < 33 | < 55 | 0.98–1.07 | 60–65 |
| Early head | 13–18 | 34–38 | 55–60 | 0.85–0.91 | 52–56 |
| Head | 8–12 | 39–41 | 61-–65 | 0.75–0.84 | 46–51 |
| Post-head | < 8 | > 41 | > 65 | < 0.75 | < 46 |
| Abbreviations: CP = crude protein; ADF = acid detergent fiber; NDF = neutral detergent fiber; ME = metabolizable energy; TDN = total digestible nutrients. | |||||
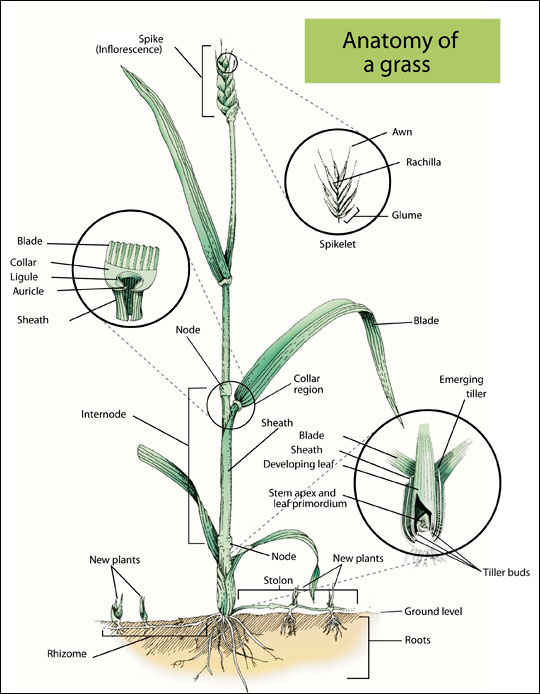
Grass plants structurally have their support and leaves intertwined, unlike the separation seen in legumes. Grass species are separated into two subgroups based on their preferred growing season: cool-season and warm-season grasses. Most grasses in the Northeast are cool-season species that start growing in early spring into the summer, then go dormant during hot weather. Warm-season grasses need higher ambient temperature to start growth and can maintain growth through the hot summer months. Grasses contain more structural fiber carbohydrates compared to legumes, and digestibility is greatly influenced by plant maturity. Commonly used cool-season grasses include timothy, orchardgrass, Kentucky bluegrass, perennial ryegrass, and tall and fine fescues. The most commonly fed warm-season grass is Coastal Bermudagrass. Warm-season grasses have greater fiber content and generally lower digestibility compared to cool-season grasses.
Legume plants are structurally similar to trees, having distinct stems or “trunks” with branches and leaves. They are unique in that they have root nodules that harbor symbiotic bacteria capable of capturing atmospheric nitrogen. This characteristic results in legumes being higher in protein content compared to grasses, and they generally have higher calcium content. Legume plants have more indigestible stems due to greater lignification, which is why camelids often eat the digestible leaves and leave the stems.
Feed Analysis Terminology
A major hurdle in the use of feed testing is the complex terminology associated with the parameters determined. The following are key values on a forage test that should be considered when evaluating forage for camelids.
Moisture and Dry Matter
We talk about feeds on an “as-fed” and “dry matter” basis relative to feeding programs. When you send a sample to the lab, the feed contains both moisture and dry matter, which is where all the nutrients are found. The lab weighs the sample, dries it, and reweighs it to determine moisture loss, leaving only dry matter. We want to compare feeds on a dry matter basis—an “apples to apples” comparison—as moisture content varies.
For hay, moisture should be 15 percent or less. As moisture increases, the risk of mold growth rises. Mold growth increases the risk for heat generation and spontaneous combustion of hay bales. Moisture content is also critical to successful fermentation of ensiled feeds. Large round hay bales often have enough moisture to allow mold growth that degrades forage quality in the center of the bale. This may become excessive, allowing for growth of Listeria or the organism that causes botulism.
Crude Protein (CP)
Forage protein content is a reasonable marker of forage quality, with more immature plants having greater protein content compared to mature plants (Table 1). Feed protein content (crude protein, or CP) is determined by measuring total nitrogen content and multiplying by 6.25 (proteins are assumed to contain 16 percent nitrogen). Sufficient dietary protein (>8 percent of dry matter) is necessary to facilitate microbial fermentation in compartment 1. If dietary protein is deficient, dry matter intake will be reduced. Crude protein alone is often sufficient to understand how the forage will meet camelid protein needs.
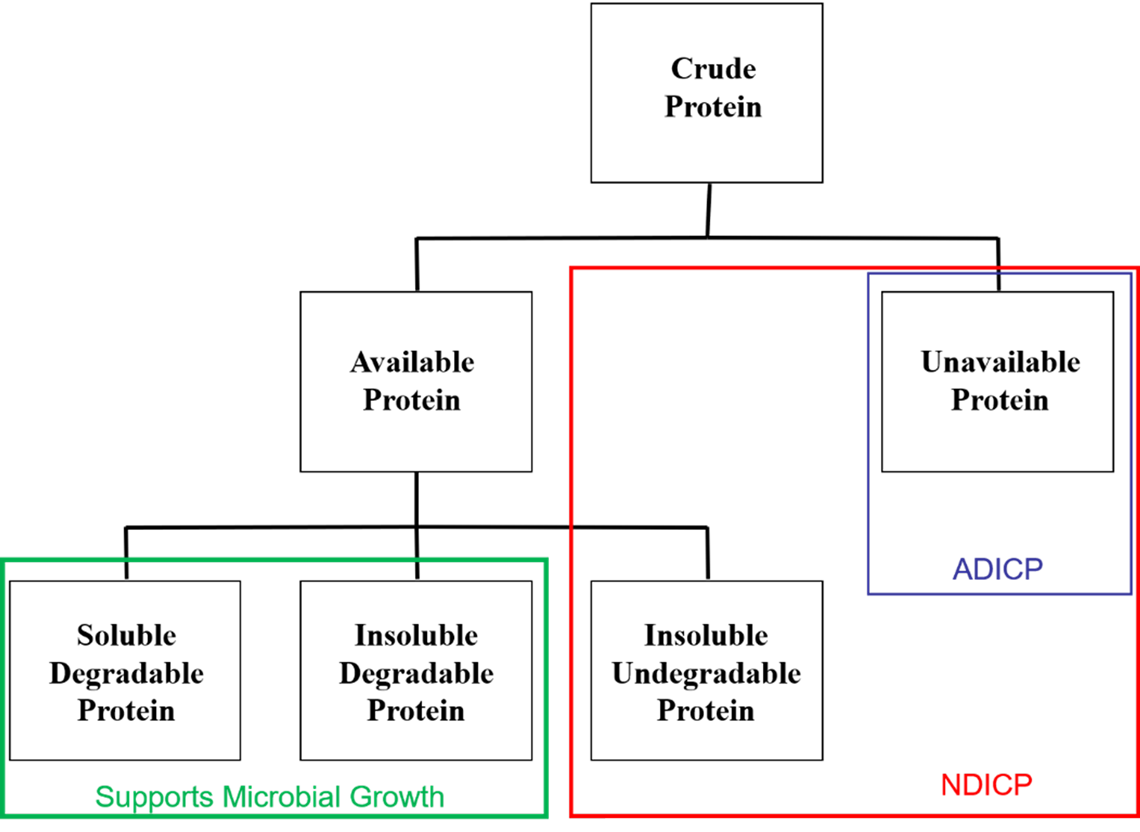
Unavailable or Bound Protein
Not all nitrogen in a feed is available to microbes or the camelid. This portion of crude protein is not degradable by fermentation microbes or digestible by the animal and is termed unavailable or bound protein. The amount of nitrogen (or crude protein) found in the acid detergent fiber residue is defined as ADIN (acid detergent insoluble nitrogen) or ADIP (acid detergent insoluble protein). This represents nitrogen bound to the plant cell wall, often due to heat damage.
The Maillard reaction causes heat damage by covalently linking nitrogen from amino acids to sugar residues in the plant cell wall. Moisture and heat are needed to promote this reaction.
Soluble Crude Protein
Soluble protein measures the total nitrogen in a feed (expressed as a percent of CP) that is potentially soluble in rumen fluid (or compartment-1 fluid in camelids). Soluble protein contains both nonprotein nitrogen (NPN) and true protein compounds. These nitrogen sources are readily used by forestomach microbes for microbial protein production and contribute to a rapid increase in the forestomach ammonia pool.
Fiber-fermenting bacteria absolutely depend upon the forestomach ammonia pool as their sole nitrogen source for protein synthesis. Mature grasses may have low soluble protein, which can limit fiber digestion and intake.
Fiber Carbohydrates
Carbohydrates make up approximately 70 percent of the camelid diet and consist of a diverse group of compounds. Plant carbohydrates are typically divided into two groups based on degradability: fiber and nonfiber carbohydrates. Fiber carbohydrates are associated with the rigid plant cell wall and are moderately to slowly degraded by forestomach microbes. Total plant cell wall carbohydrates are measured as neutral detergent fiber (NDF). A subset of NDF is acid detergent fiber (ADF), which measures cellulose and other less digestible components of the plant cell wall.
Both NDF and ADF increase with plant growth and aging (see Table 1) and are good measures of forage quality when their values are lower. Relationships of NDF and ADF differ depending on whether the plant is a grass or a legume.
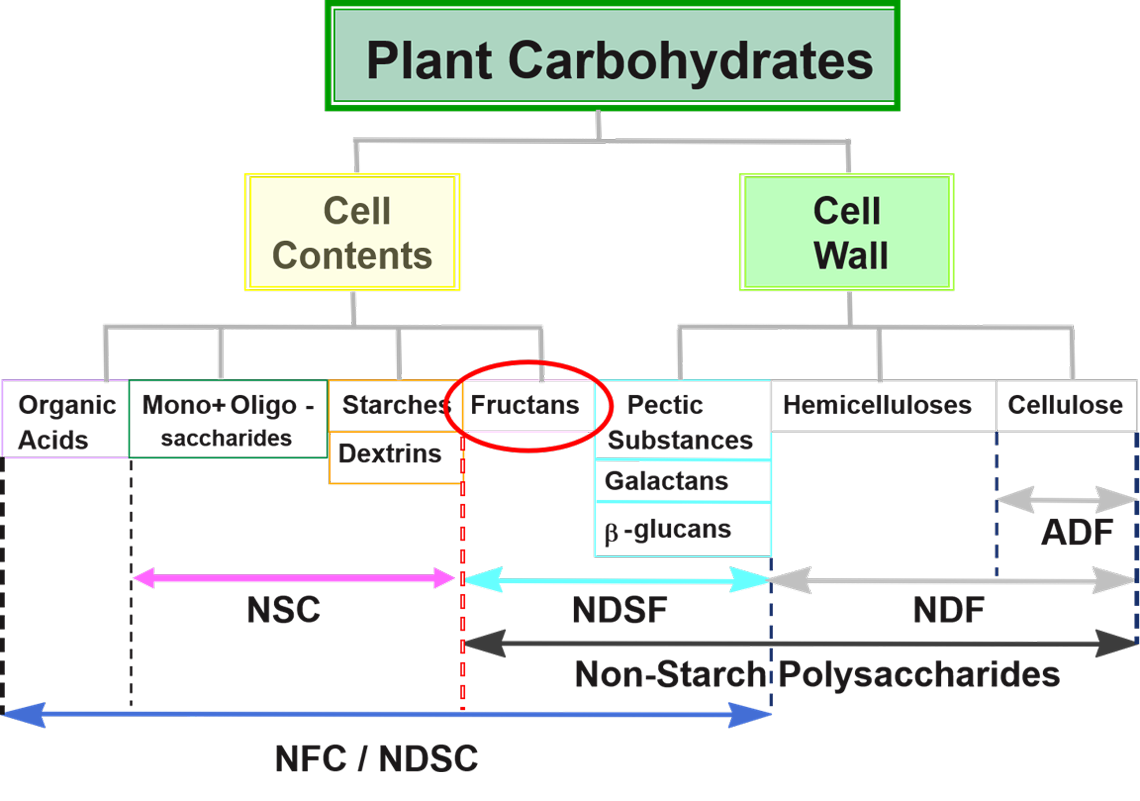
Degradable Carbohydrates
Carbohydrates found in the plant cell cytoplasm (storage forms such as starch or sucrose) or the secondary cell wall are more readily fermented or digested. One method of defining these carbohydrates is calculating nonfiber carbohydrates (NFC), which includes all carbohydrates not accounted for in the NDF fraction. NFC is diverse and includes sugars, starches, and fermentable neutral detergent soluble fiber.
In camelids, we are cautious about the amount of sugars and starch present in the diet; however, NFC is not a precise measure of these individual carbohydrates. A directly measured parameter of degradable carbohydrates is nonstructural carbohydrates (NSC). This procedure enzymatically degrades starch and complex sugars into glucose to determine total sugar and starch content of a feed. This value is more important relative to feeding camelids because we do not want to feed excessive starch.
Minerals
Mineral content is one of the most important components of feed analysis. Ash provides a perspective on total mineral content of the feed. Both macrominerals—calcium (Ca), phosphorus (P), magnesium (Mg), potassium (K), sodium (Na), and sulfur (S)—and microminerals—iron (Fe), copper (Cu), manganese (Mn), zinc (Zn), and molybdenum (Mo)—should be determined by wet chemistry methods.
Selenium can be determined at some forage laboratories; however, the cost is high, and measuring selenium in blood samples may be more practical. Use of NIR to determine forage or feed mineral content is not recommended, as mineral values are not adequately quantified.
Molybdenum should be requested due to its potential interaction with copper availability. Most labs can measure all these minerals, though sulfur and molybdenum may require an additional fee.
A Systematic Approach to Interpreting Feed Analysis Reports
A feed analysis report can be overwhelming, with many abbreviations and numbers. Each laboratory has its own reporting format, which adds to the challenge if you use more than one lab. The following systematic approach can help you decide whether a forage is adequate for camelids and identify potential nutritional risks.
- Check moisture content of hay.
- Dry matter should be at least 85 percent (moisture below 15 percent).
- Review crude protein and protein fractions.
- Crude protein should be a minimum of 8 percent if feeding forage only; higher protein is preferred for pregnant, lactating, or growing animals.
- Soluble protein should be a minimum of 25 percent and preferably 30–35 percent of CP.
- Rumen degradable protein—this is a measure for dairy cows but can be used in camelids. Look for higher values (>65%)
- Evaluate fiber carbohydrates.
- Calculate the ADF-to-NDF ratio. Values close to 0.6 or lower indicate a grass forage. Values close to 0.8 or higher indicate a legume forage. Intermediate values suggest mixed forages.
- Grass forages with NDF greater than 65 percent should not be fed to higher-producing animals but can be used for maintenance or high-body condition score animals.
- Legume forages with NDF greater than 50 percent are very mature and will not be readily consumed by camelids.
- If lignin is provided, calculate lignin-to-NDF as a percentage. For grasses, values less than 8.5 percent are more readily digested. For legumes, values less than 17 percent are more readily digested. Higher values within each forage type indicate more lignified cell wall and more slowly fermented forage.
- Evaluate degradable carbohydrates.
- Review NFC and NSC values.
- For grass forages, a good NFC value is 20–25 percent. For legumes, NFC is much higher (35–45 percent) but largely due to fermentable fiber from pectin.
- Starch content of forages is typically less than 3 percent. For pellets, starch should be under 20 percent and preferably around 15 percent.
- Review macrominerals.
- Calculate the calcium-to-phosphorus ratio; it should be 2:1 or slightly higher. Legume forages may be very high (>6:1).
- Check calcium content in grass forages to be sure it is above 0.45 percent. Higher values are needed for lactating and growing camelids.
- If phosphorus content is greater than calcium content, do not use that forage. This greatly increases the potential for urinary calculi in males.
- Forages with phosphorus >0.25 percent typically are overfertilized. See whether potassium is also increased.
- Forage magnesium <0.10 percent is low and typical of some grasses. Legumes typically have higher magnesium (0.2 percent or more).
- Forage potassium is usually higher than required. Values >2.5 percent are problematic.
- Evaluate trace mineral values.
- Typical iron content is 100–300 ppm. Values over 1,000 ppm usually indicate soil contamination.
- Manganese is much higher in grass than in legume forages. A value around 40 ppm is desired.
- Zinc is typically low in all forages (<30 ppm).
- Copper is variable depending on geography. Forage copper is higher east of the Mississippi River (>9 ppm). Hay from dairy farms may have high copper (>15 ppm) due to copper sulfate footbaths. Potential toxicosis could occur with forage containing >20 ppm copper.
- Molybdenum should be measured due to its impact on copper status. High forage molybdenum is sporadic geographically. A copper-to-molybdenum ratio <4:1 risks copper deficiency. A high ratio (>16:1) places animals at risk for copper toxicosis.
With this systematic approach to understanding the forage or feed analysis report, you can make informed decisions on the appropriateness of a forage for your feeding program or identify potential nutritional risks underlying animal disease issues (Table 2). Failing to meet the nutrient needs of a given animal—or providing an excessive amount of a nutrient—will result in specific clinical disease conditions (Table 3). All nutrients influence the immune system, and marginal deficiencies can lead to subclinical disease, often recognized as poor performance (reduced rate of gain, impaired fertility) and increased disease susceptibility.
| Table 2. Summary of suggested dietary nutrient content for alpacas in different life stages.1 | ||
Group |
Physiologic State |
Dietary Guidelines* |
| Nursing Dams with crias | Lactation | 60 to 70% TDN, 0.98 to 1.15 Mcal/lb ME 12-14% Crude protein, 0.9% BW NDF, 0.45-0.62% Ca, 0.32-0.45% P,** |
| Weanlings up to 1.5 years | Growth | 55 to 65% TDN, 0.90 to 1.07 Mcal/lb ME 14-16% Crude protein, 0.6-0.8% BW NDF, 0.53-0.73% Ca, 0.27-0.38% P, ** |
| Males >1 year | Maintenance | 55 to 60% TDN, 0.90 to 0.98 Mcal/lb ME 8-10% Crude protein, 0.8-1.0% BW NDF, 0.3-0.48% Ca, 0.21-0.28% P,** |
| Pregnant females 1–8 months | Maintenance | 50 to 55% TDN, 0.82 to 0.90 Mcal/lb ME 8-10% Crude protein, 0.8-0.9% BW NDF, 0.2-0.24% Ca, 0.12-0.2% P |
| Pregnant females 9–11 months | Pregnancy | 55 to 70% TDN, 0.90 to 1.15 Mcal/lb ME 10-14% Crude protein, 0.6-0.8% BW NDF, 0.45-0.56% Ca, 0.28-0.33% P, **,† |
| Breeding females | Maintenance |
50 to 55% TDN, 0.82 to 0.90 Mcal/lb ME |
| Obese females | Sub-Maintenance | 45 to 53% TDN, 0.74 to 0.87 Mcal/lb ME 8-9% Crude protein, 0.8-1% BW NDF, 0.2-0.24% Ca, 0.12-0.2% P |
| ¹Abbreviations: TDN = total digestible nutrients; ME = metabolizable energy; BW = body weight; NDF = neutral detergent fiber; Ca = calcium; P = phosphorus. *Ensure adequate available water and free-choice salt. White salt should be used when trace minerals are included in a supplement. Otherwise, trace mineral salt should be available. **These feeding groups require higher amounts of trace minerals and vitamins, preferably delivered by a supplement. †Dietary energy and crude protein content may need to be increased further in late pregnancy if dry matter intake drops below 1.5 percent of body weight. | ||
| Table 3. Disease conditions associated with either inadequate (deficiency) or excessive (toxicosis) intakes of essential nutrients. Not all essential nutrients have been described for causing disease in camelids. | ||
Nutrient of Concern |
Deficiency Disease Condition |
Toxicosis Disease Condition |
| Energy | Body condition and body weight loss; risk for hepatic lipidosis | Obesity; excessive body condition |
| Protein | Reduced growth in crias; increased infectious disease susceptibility; reduced milk production in lactation | Impaired reproduction; higher embryonic losses |
| Dietary fiber (NDF) | May induce abnormal eating behaviors (pica) or result in lower pH in the forestomach | Excessive dietary NDF will restrict intake capacity |
| Calcium | Rickets in crias or bone fractures in adults | May reduce feed intake |
| Phosphorus | Rickets in crias or bone fractures in adults | High risk for urinary calculi in males |
| Iron | Anemia or low red blood cell count | Pro-oxidant effects |
| Copper | Impaired reproduction; cria growth and disease susceptibility; altered fleece quality | Hepatic necrosis with possible renal failure |
| Selenium | Nutritional myodegeneration (white muscle disease), mostly in young crias | Acute cardiovascular collapse; impaired fleece and toenail quality |
| Vitamin D | Hypophosphatemic rickets in crias; bone density issues with fractures in adults | Metastatic calcification of soft tissues |
| Table 4. Determined nutrient content of the two hay forages shown in Figure 1. | ||||
Components |
Hay A |
Hay B | ||
As Sampled |
Dry Matter |
As Sampled |
Dry Matter | |
| % Moisture | 9.0 | — | 8.9 | — |
| % Dry Matter | 91.0 | — | 91.1 | — |
| % Crude Protein | 12.1 | 13.3 | 6.3 | 6.9 |
| % Acid Detergent Fiber | 32.3 | 35.5 | 34.0 | 37.3 |
| % Neutral Detergent Fiber | 46.5 | 51.1 | 52.8 | 58.0 |
| % Nonfiber Carbohydrates | 24.0 | 26.4 | 23.7 | 26.0 |
| % Total Digestible Nutrients | 56 | 62 | 55 | 60 |
| Metabolizable Energy, Mcal/lb | 0.92 | 1.02 | 0.90 | 0.98 |
| % Calcium | 0.46 | 0.51 | 0.32 | 0.35 |
| % Phosphorus | 0.23 | 0.25 | 0.15 | 0.16 |
| % Magnesium | 0.17 | 0.19 | 0.14 | 0.15 |
| % Potassium | 2.58 | 2.84 | 1.53 | 1.68 |
| % Sodium | 0.013 | 0.014 | 0.021 | 0.025 |
| Iron, ppm | 97 | 107 | 95 | 104 |
| Zinc, ppm | 20 | 22 | 19 | 21 |
| Copper, ppm | 8 | 9 | 11 | 12 |
| Manganese, ppm | 65 | 71 | 36 | 40 |
| Molybdenum, ppm | 1.6 | 1.8 | 0.9 | 1.0 |
Summary
Producers offer many reasons for not performing feed testing, such as cost, interpretation, or practicality. The information in this article provides a foundation for understanding feed analysis procedures and their application in a feeding program. Forage quality—or lack of it—is the single most critical factor that can make or break a camelid feeding program.
Being able to interpret the numbers provided on a forage or feed test report can help you provide a complete and balanced diet for your animals and reduce the risk of nutrition-related disease.